
Open any trading platform and you will see charts covered in lines, bands and coloured bars. That is technical analysis: the study of past prices and volumes to guess what might come next.
In this article
The core idea
Technical analysts believe that prices reflect all available information, and that human behaviour creates repeating patterns. Rather than asking what a coin is worth, they ask where the price is heading based on its chart.
Common tools
- Support and resistance: price levels where buyers or sellers have often stepped in.
- Trend lines: lines connecting highs or lows to show direction.
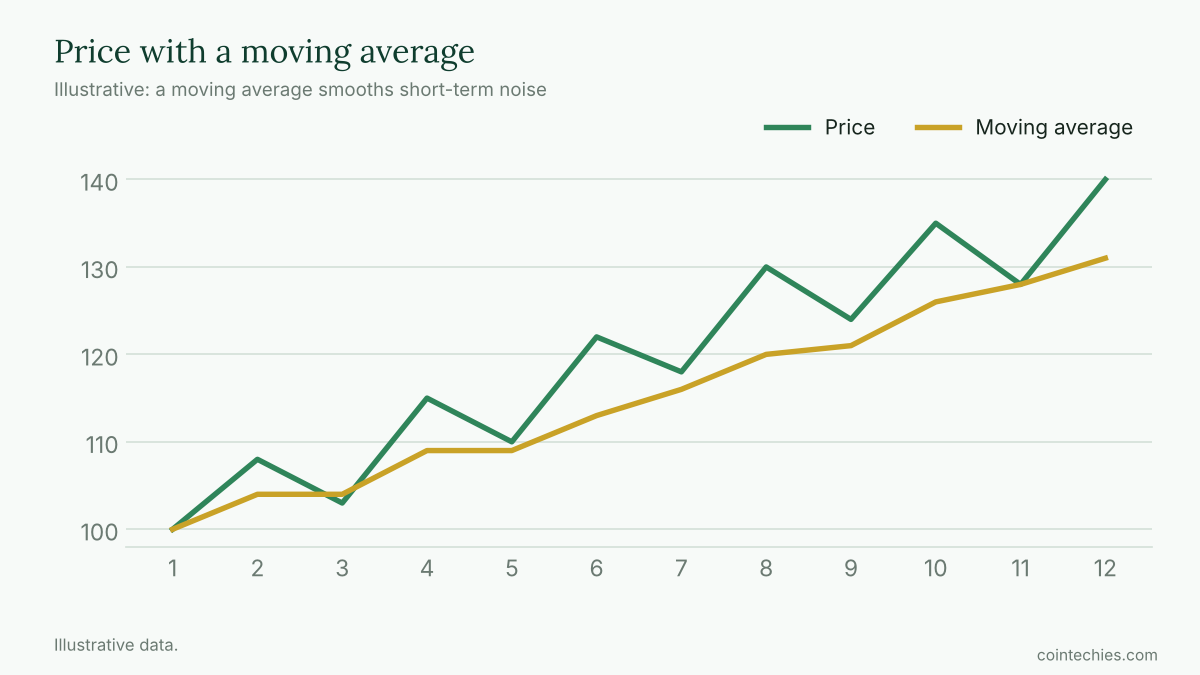
- Moving averages: the average price over a number of days, smoothing noise.
- RSI: an indicator that measures whether a move may be stretched.
- Volume: how much is traded, showing the strength behind a move.
- Candlesticks: bars that show open, high, low and close for each period.
Why people use it
In crypto, there are no earnings reports for most coins, so charts and sentiment fill the gap. Markets also trade around the clock and react to emotion, which technicians say leaves visible traces.
Does it work?
The honest answer: partly, and not reliably. Some patterns, like trends, appear often enough to be useful as context. But many signals fail, and two analysts can read the same chart differently. Studies of technical rules in traditional markets show mixed results, and costs eat into returns.
In crypto, thin liquidity and sudden news can break any pattern in seconds. A chart cannot predict a hack or a regulation announcement.
How to use it sensibly
- Treat it as a tool for timing and risk, not a crystal ball.
- Use a few simple indicators, not a dozen.
- Look at higher time frames, such as daily and weekly, for a clearer picture.
- Combine it with an understanding of the asset and the news.
- Always set a stop-loss and size positions small.
Beware of bias
It is easy to see patterns after the fact, and to ignore signals that don’t fit your view. Test an idea on past data before you trust it with real money, and keep a journal of results.
The bottom line
Technical analysis can help you organise your thinking about entries, exits and risk, but it doesn’t predict the future. Use it humbly and never let a line on a chart replace risk management.
This article is for educational purposes only and is not financial advice. Trading carries a high risk of loss. Crypto assets are volatile and you can lose some or all of your investment.



Laisser un commentaire