Crypto prices zig-zag all day long. A moving average cuts through the noise and shows you which way the market is going. It’s one of the oldest and most widely used tools.
In this article
What it is
A moving average is the average price over the last number of periods, recalculated as each new one arrives. A 50-day moving average, for example, takes the last 50 daily closes and averages them. Because it keeps updating, it moves along with the price.
Two flavours
- Simple moving average (SMA): each day counts equally.
- Exponential moving average (EMA): recent days count more, so it reacts faster.
Shorter averages, such as 10 or 20 days, react quickly. Longer ones, such as 100 or 200 days, show the big picture.
The popular settings
The 50-day and 200-day averages are watched by many investors. When price sits above the 200-day, the long-term trend is often seen as healthy. When it falls below, caution rises.
Crossovers
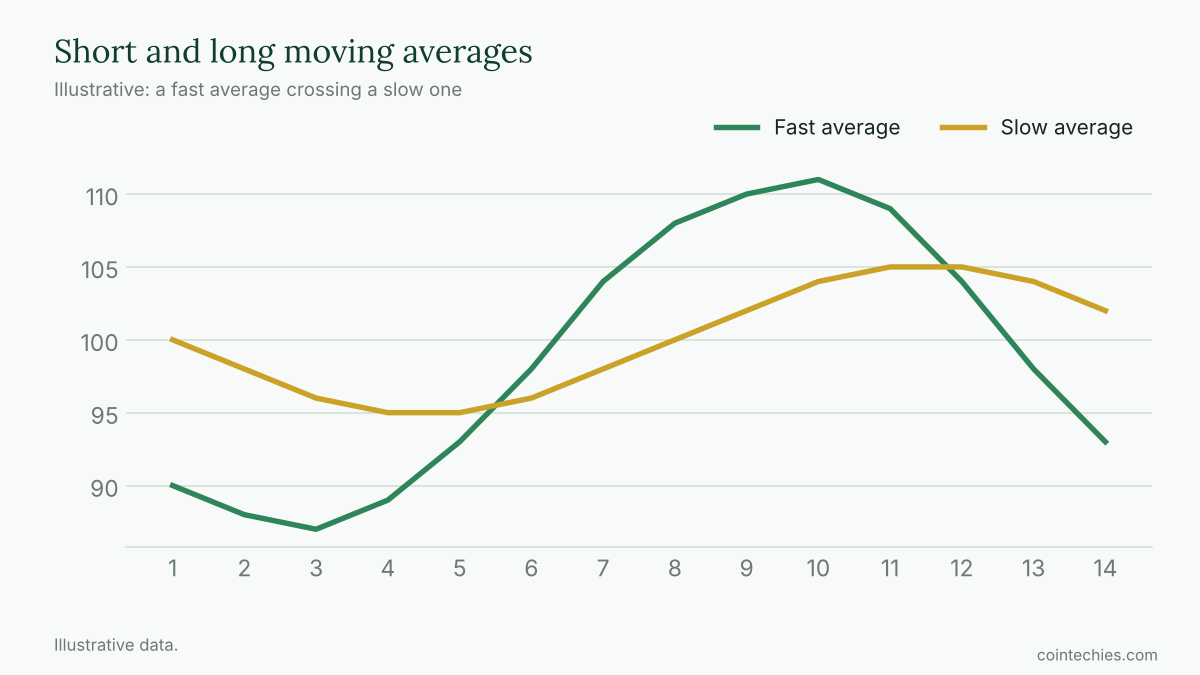
When a short average crosses above a long one, it is called a golden cross and is seen as bullish. When it crosses below, it is a death cross, seen as bearish. These signals come after the price has already moved, so they confirm trends rather than predict them.
Moving averages as support and resistance
In a trend, price often pulls back to a moving average and bounces. Many traders use the 20 or 50 day line as a dynamic support in uptrends, and as resistance in downtrends.
Strengths
- Simple and easy to understand.
- Objective: no drawing needed.
- Good for filtering noise and staying with a trend.
Weaknesses
- They lag, so signals arrive late.
- In sideways markets they produce many false signals.
- Different settings give different answers, which tempts people to cherry-pick.
Tips for using them well
- Choose one or two settings and stick with them.
- Use them on daily and weekly charts for clearer signals.
- Combine with volume and key price levels.
- Do not trade every crossover; confirm with the wider trend.
The bottom line
Moving averages turn a jumpy chart into a readable trend. They won’t predict the future, but they help you stay with the direction of the market and avoid reacting to every wiggle.
This article is for educational purposes only and is not financial advice. Trading carries a high risk of loss. Crypto assets are volatile and you can lose some or all of your investment.

Laisser un commentaire