
If you only learn one idea in technical analysis, make it this one. Support and resistance are the price levels where a market has repeatedly paused or turned around.
In this article
Support: the floor
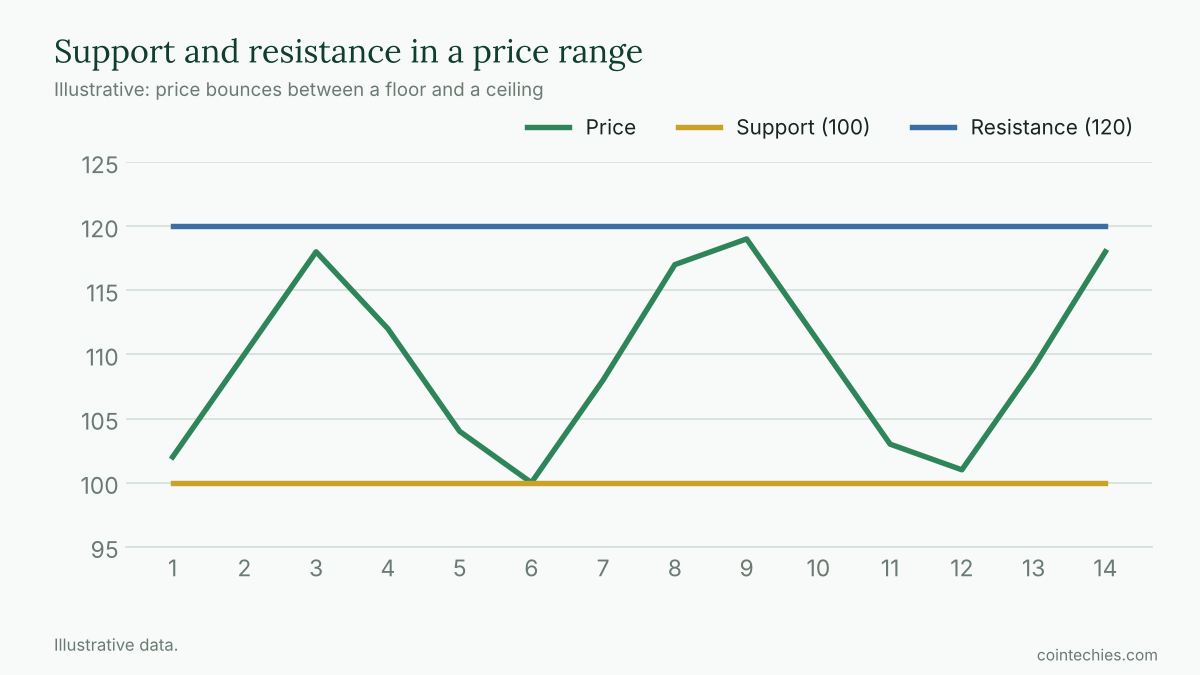
Support is a price area where buyers have stepped in before, stopping a fall. Think of a ball bouncing off a floor. When the price drops to that zone, traders expect demand again, because some bought there previously and others see it as good value.
Resistance: the ceiling
Resistance is a price area where sellers have appeared before, stopping a rise. When the price climbs to that level, some holders sell to take profit or get out at break-even, and the move stalls.
Why these levels form
They come from memory and psychology. People remember prices where they bought, sold or missed out, and place orders around round numbers and past highs and lows. Because many traders watch the same levels, the levels become self-reinforcing.
How to find them
- Zoom out to a daily or weekly chart.
- Mark prices where the market reversed at least twice.
- Draw zones, not exact lines. A level is usually a band.
- Include round numbers like $50,000 or $100, which attract orders.
- Note previous all-time highs and major lows.
What happens when they break
When price pushes through resistance, that old ceiling often becomes new support. When price falls through support, it can turn into resistance. This is called a role reversal.
A real breakout usually comes with strong volume and a candle that closes beyond the level. A fake breakout pokes through and quickly returns, trapping traders.
How traders use them
- Entries: buying near support or after a confirmed breakout above resistance.
- Stops: placing a stop-loss just beyond a level so a break signals the idea is wrong.
- Targets: taking profit just before the next resistance.
- Risk-reward: judging whether the distance to the target justifies the risk.
Common mistakes
- Drawing too many lines until the chart is a maze.
- Treating levels as exact prices instead of zones.
- Trading every touch rather than waiting for confirmation.
- Ignoring the bigger trend.
The bottom line
Support and resistance show where buyers and sellers have acted before. They are simple but powerful for planning entries, stops and targets, as long as you treat them as zones and wait for confirmation.
This article is for educational purposes only and is not financial advice. Trading carries a high risk of loss. Crypto assets are volatile and you can lose some or all of your investment.



Laisser un commentaire