Candlestick charts are the standard view for traders. They look busy at first, but each candle tells a simple story about what happened to the price in a set period.
In this article
What one candle shows
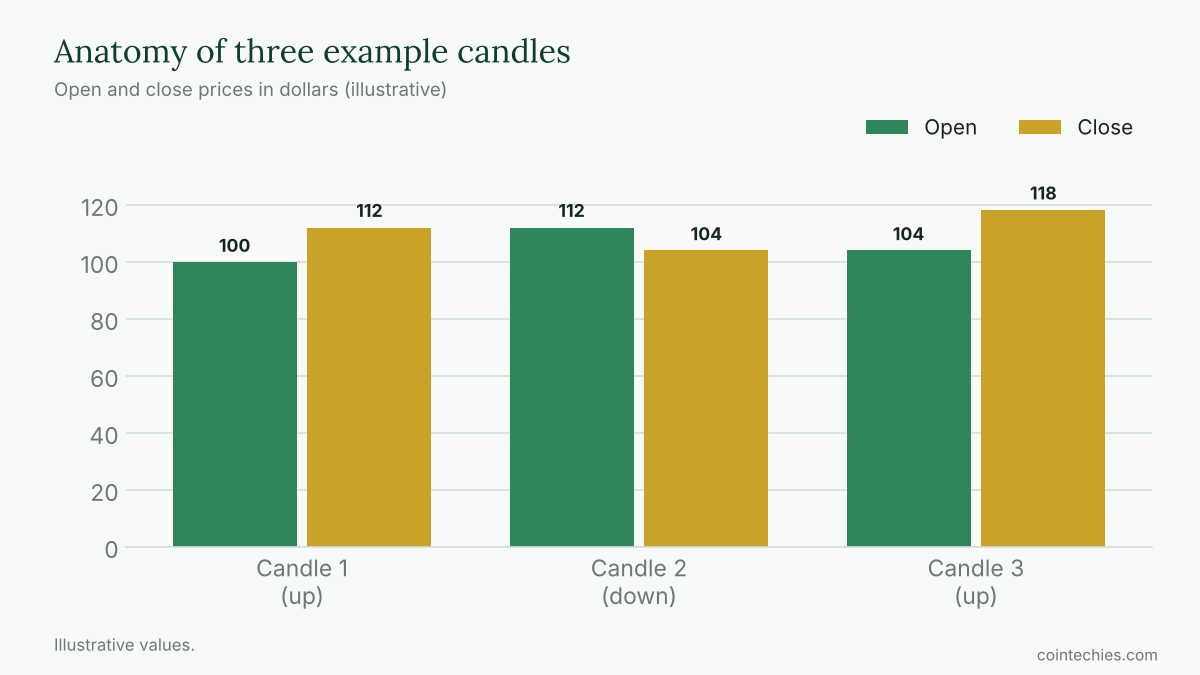
Each candle covers a time period, such as one hour or one day, and displays four prices:
- Open: the price at the start of the period.
- Close: the price at the end.
- High: the highest price reached.
- Low: the lowest price reached.
The thick part is called the body, between open and close. The thin lines above and below are wicks, or shadows, showing the high and the low.
Colours
Most charts colour a candle green when it closed higher than it opened, and red when it closed lower. Some platforms let you change this, so check the legend.
Reading the body and wicks
- A long body means strong buying or selling pressure.
- A short body means indecision.
- A long upper wick means buyers pushed the price up but sellers pushed it back.
- A long lower wick means sellers pushed it down but buyers recovered.
A few well-known patterns
- Doji: open and close almost equal, with a tiny body. It shows balance and possible change.
- Hammer: a small body with a long lower wick after a fall, hinting that buyers are stepping in.
- Shooting star: a small body with a long upper wick after a rise, hinting that sellers are emerging.
- Engulfing: a candle whose body fully covers the previous one, suggesting a shift in momentum.
Time frames
The same market looks different on a one-minute chart and a daily one. Short frames show noise, long frames show the trend. Beginners usually get a clearer view from the four-hour, daily and weekly charts.
Step-by-step routine
- Pick a time frame.
- Look at the overall trend: higher highs and lows, or the reverse.
- Mark nearby support and resistance.
- Read the last few candles for pressure and rejection.
- Check volume for confirmation.
- Decide your stop-loss and size before entering.
Don’t over-trust patterns
A pattern is a hint, not a promise. Context, such as the trend and levels, matters more than a single shape.
The bottom line
Candlesticks compress open, close, high and low into one picture. Learn the anatomy, read the pressure in bodies and wicks and use patterns as clues alongside risk management.
This article is for educational purposes only and is not financial advice. Trading carries a high risk of loss. Crypto assets are volatile and you can lose some or all of your investment.

Laisser un commentaire