A notable market watcher gives a timeline that will see XRP reach a price almost double its 2017/2018 all-time high.
By comparison, XRP is operating in a volatile market environment amid general bearish trends triggered by hawkish comments from the Federal Reserve. Recent comments from Fed Chair Jerome Powell suggested lower-than-expected interest rate cuts in 2025.
A steep drop
This reality, coupled with comments about regulatory restrictions prohibiting the Fed from holding Bitcoin, has weighed heavily on the cryptocurrency market.
XRP reacted with heavy losses, Drop of 9.91% on Wednesday and another 3.24% the following day. The token fell to $1.96 on December 20, but showed bullish momentum, leading to a 4.35% rally to $2.37 at press time this morning.
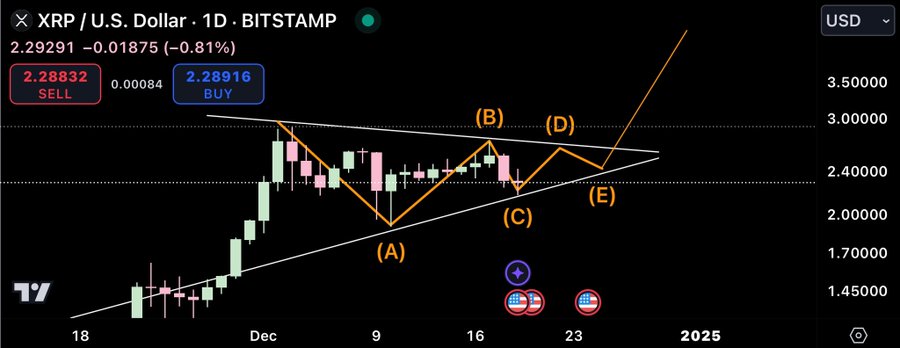
Meanwhile, analysts like CryptoBull believe that this correction is a harbinger of a major breakout. CryptoBull has divided a chart with a symmetrical triangle formation, indicating that XRP may be completing its correction phase.
According to the well-known market commentator, this structure will unravel within the next week. He expects such a decision to push XRP to a new all-time high of $6 within days of the breakout.
XRP’s symmetrical triangle
The 1-day chart shows that the symmetrical triangle pattern developed after XRP’s sharp decline from $2.9, its seven-year high, on December 3rd.
This pattern typically represents market indecision, with prices consolidating as bulls and bears compete for dominance. In particular, with XRP now near the top of the triangle, this position suggests that a breakout is imminent.

The structure started with a steep…


